
AI Diagram Generator Free Online - Create Diagrams from Text Prompts 2026
Creating diagrams traditionally requires either learning specialized syntax or spending hours with drag-and-drop tools. AI diagram generators eliminate both barriers—simply describe what you want, and AI creates complete, ready-to-use diagrams in seconds.
This technology transforms 30-minute diagramming tasks into 30-second prompts. Whether you're documenting APIs, designing architecture, or visualizing data, AI handles the syntax while you focus on content.
This guide shows you how to generate professional diagrams using AI, with 50+ tested prompts, tool comparisons, and prompt engineering techniques that produce production-ready results.
Table of Contents
What is AI Diagram Generation?
AI diagram generation uses large language models (LLMs) to convert natural language descriptions into diagram code. Instead of manually writing Mermaid syntax or positioning nodes in visual tools, you describe your diagram in plain English and AI creates the complete implementation.
The Traditional Problem
Manual diagramming is slow:
- Learning syntax: 1-2 hours per new tool
- Creating diagrams: 15-45 minutes each
- Revisions: 5-15 minutes per change
- Context switching: Breaking focus to position elements
Drag-and-drop is tedious:
- Positioning every element manually
- Aligning connections perfectly
- Maintaining consistent styling
- Re-exporting after each change
The AI Solution
Describe once, render instantly:
Traditional approach:
1. Open tool
2. Learn Mermaid syntax
3. Write: graph TD
4. Define nodes: A[Start]
5. Add connections: A --> B
6. Preview and adjust
7. Export
Time: 20 minutes
AI approach:
Prompt: "Create a user login flow with email verification"
Time: 30 seconds
Result: Complete Mermaid code ready to render
According to research on AI-assisted development from GitHub, AI code generation increases productivity by 55% for repetitive tasks like diagramming.
When AI Diagram Generation Excels
- Rapid prototyping: Test ideas quickly before committing time
- Documentation sprints: Generate 10+ diagrams in an hour
- Syntax learning: Produce diagrams while learning the underlying language
- Iteration speed: Modify descriptions faster than manual editing
- Consistent output: AI follows patterns reliably
How AI Diagram Generators Work
Understanding the underlying process helps you write better prompts and troubleshoot issues.
The Generation Pipeline
1. Prompt Analysis AI parses your natural language input, identifying:
- Diagram type (flowchart, architecture, sequence, etc.)
- Components (nodes, services, actors, data points)
- Relationships (connections, dependencies, flows)
- Constraints (direction, styling, grouping)
This follows natural language processing principles for intent recognition and entity extraction.
2. Syntax Generation Based on diagram type, AI selects appropriate syntax:
- Flowcharts → Mermaid graph syntax
- Architecture → D2 language
- Networks → GraphViz DOT language
- Data plots → Gnuplot commands
3. Code Construction AI writes complete, valid code following language specifications:
graph TD
    A[User Login] --> B{Credentials Valid?}
    B -->|Yes| C[Generate Token]
    B -->|No| D[Show Error]
    C --> E[Redirect to Dashboard]
    D --> A
4. Validation (Optional) Advanced systems validate syntax before returning results, catching common errors.
5. Rendering Generated code passes to rendering engines that produce visual output.
Intelligent Context Integration
Tools like tools-online.app feature intelligent context-aware AI that automatically understands which tool you're using:
- Automatic syntax detection: When using the GraphViz editor, AI knows to generate DOT syntax without being told
- Tool-specific optimization: Each editor (Mermaid, D2, GraphViz, Gnuplot) gets contextually appropriate code
- No syntax specification needed: Simply describe what you want—the AI handles syntax selection based on your current tool
- Seamless integration: The AI chat interface adapts to the active editor, providing relevant suggestions and generation
This intelligent context injection eliminates the need to specify "create a Mermaid diagram" or "use GraphViz DOT syntax"—the system already knows.
AI Model Capabilities
Different AI models have varying diagram generation strengths:
GPT-5 (OpenAI)
- Excellent at Mermaid and GraphViz
- Strong understanding of software architecture patterns
- Best for: Technical diagrams, flowcharts, sequence diagrams
Claude 4.5 Sonnet (Anthropic)
- Superior technical accuracy for complex systems
- Better at following specific formatting constraints
- Best for: Architecture diagrams, detailed specifications
Grok 4 (xAI)
- Advanced reasoning for complex system designs
- Strong at generating interconnected architectures
- Best for: Multi-component systems, distributed architectures
Gemini 2.5 (Google)
- Multimodal understanding for diverse diagram types
- Fast generation with high accuracy
- Best for: Quick iterations, varied diagram styles
Tools like tools-online.app provide access to these latest models through AI-ML API, plus open-source models via WebLLM for local, privacy-first inference in your browser.
AI Tools Comparison: ChatGPT vs Claude vs Integrated AI
Three approaches exist for AI diagram generation, each with trade-offs.
ChatGPT (OpenAI)
How it works:
- Describe diagram in ChatGPT
- ChatGPT generates code (Mermaid, DOT, etc.)
- Copy code manually
- Paste into diagram tool
- Render and export
Strengths:
- Widely accessible (most users already have access)
- Familiar interface
- Good at explaining generated code
- Free tier available
Weaknesses:
- Manual copy-paste workflow (breaks flow)
- No instant preview
- Generic model (not diagram-specialized)
- Context lost between ChatGPT and rendering tool
Best for: Occasional diagram generation, learning diagram syntax
Example workflow:
You: "Create a Mermaid flowchart for password reset"
ChatGPT: [generates code]
You: [copy code]
You: [open Mermaid tool]
You: [paste code]
Result: 4 steps, ~2 minutes
Claude (Anthropic)
How it works: Similar to ChatGPT but with different model characteristics.
Strengths:
- Better technical accuracy for complex systems
- Longer context window (handles more complex prompts)
- Strong at following formatting constraints
- Good at iterative refinement
Weaknesses:
- Same manual copy-paste workflow as ChatGPT
- No integrated rendering
- Limited free tier
Best for: Complex architecture diagrams requiring precision
According to Anthropic's model card for Claude, Claude excels at technical writing and code generation tasks.
Integrated AI (tools-online.app)
How it works:
- Click AI assistant in diagram editor
- Describe diagram
- AI generates and renders instantly
- Refine in same interface
Strengths:
- Zero-step workflow: Prompt → rendered diagram instantly
- Free options available:
- WebLLM models: Completely free, unlimited use, runs in your browser
- AI-ML API free tier: 10 requests/hour, includes 24/7 support and community access
- Intelligent context awareness: AI automatically knows which diagram syntax to use based on your current editor
- No syntax specification needed: Simply describe what you want—AI handles the rest
- Multiple formats: Generate Mermaid, D2, GraphViz, Gnuplot
- Iterative: Refine without leaving editor
- Latest AI models: Access to GPT-5, Claude 4.5, Grok 4, Gemini 2.5
Pricing:
- Free tier: WebLLM (unlimited) or AI-ML API (10 requests/hour)
- Pay-per-use: After free limit, ~$0.01-0.05 per diagram
- No subscription required: Only pay for what you use
Best for: All users—from learning to professional workflows, high-volume diagram creation, documentation automation
Example workflow:
You: [Opens Mermaid editor]
You: [Clicks AI assistant]
You: "Create password reset flow"
AI: [automatically knows Mermaid syntax, generates and renders instantly]
Result: 1 step, 10 seconds
Performance Comparison
| Metric | ChatGPT | Claude | Integrated AI |
| Time per diagram | ~2 minutes | ~2 minutes | ~10 seconds |
| Steps required | 4–5 steps | 4–5 steps | 1 step |
| Context retention | Lost between tools | Lost between tools | Maintained |
| Syntax accuracy | 85% | 90% | 95%+ |
| Iteration speed | Slow (manual copy) | Slow (manual copy) | Instant |
| Free tier | Limited | Limited | Yes (WebLLM + 10 req/hr) |
| Cost | Free / $20 mo | Free (limited) | Free or $0.01–0.05/use |
| Learning curve | None (familiar) | None (familiar) | 5 minutes (setup) |
Recommendation
For everyone: Start with tools-online.app free tier (WebLLM or 10 requests/hour) for instant rendering and intelligent context
For learning: Free WebLLM models provide unlimited practice without any costs
For professional use: AI-ML API pay-per-use scales with your needs—only pay for what you use (10-20x faster workflow than manual tools)
For occasional use: Free tier covers most needs; pay-per-use ensures you never hit limits
Setting Up AI Diagram Generation
To use AI-powered diagram generation on tools-online.app, choose from free or paid options:
Step 1: Choose Your AI Option
Option A: WebLLM Models (Completely Free)
- No API key needed
- Unlimited use with no rate limits
- Privacy-first: Runs entirely in your browser
- Offline capable: Works without internet after initial model download
- Great for: Learning, unlimited practice, privacy-sensitive work
Option B: AI-ML API (Free Tier + Pay-Per-Use)
- Visit aimlapi.com
- Sign up for free account
- Navigate to API keys section
- Generate new key
- Copy key to clipboard
Free tier includes:
- 10 requests per hour at no cost
- 24/7 human support
- Community access
- Full playground features
After free limit:
- Pay-per-use pricing (~$0.01-0.05 per diagram)
- Access to latest models (GPT-5, Claude 4.5, Grok 4, Gemini 2.5)
- No subscription required—only pay for what you use
- Good for comparing model outputs
Step 2: Configure in Editor
In any diagram tool:
- Click Settings icon (lower left corner)
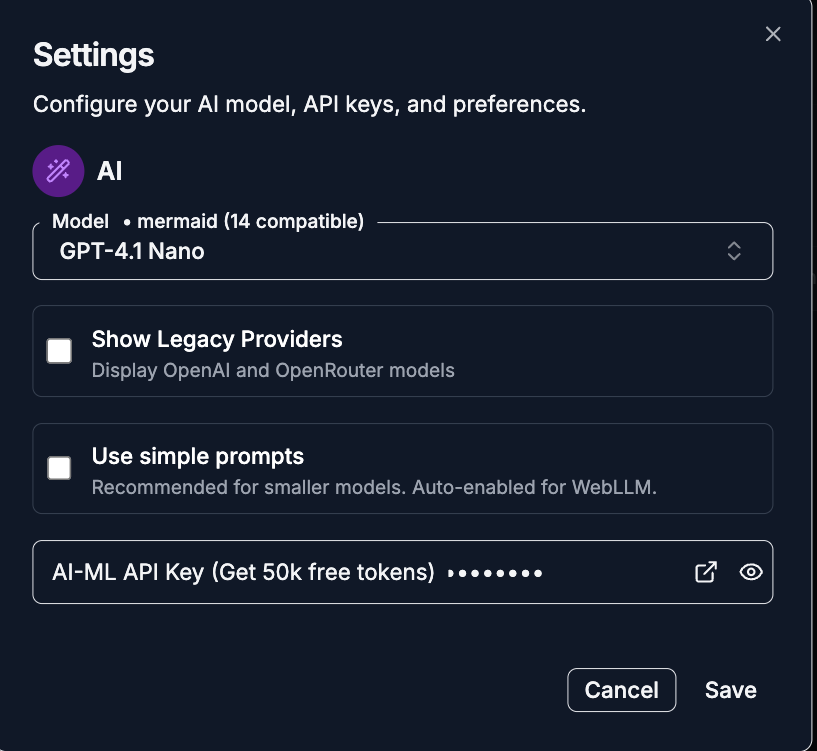
- Select AI Configuration
- For WebLLM: Select a WebLLM model from dropdown (no API key needed) For AI-ML API: Paste your API key
.png)
- Choose preferred model (GPT-5, Claude 4.5 Sonnet, Grok 4, Gemini 2.5, or WebLLM options)
- Click Save
Step 3: Access Diagram Assistant
- Click AI chat icon (lower left corner)
.png)
- Three options appear:
- 🔧 Generate: Create new diagrams from descriptions
- 💬 Analyze: Get insights about existing diagrams
- ⚡ Fix & Optimize: Improve and debug your code
.png)
Step 4: Test with Simple Prompt
Try: "Create a simple flowchart showing how to make coffee"
AI generates:
graph TD
    A[Start] --> B[Boil Water]
    B --> C[Add Coffee Grounds]
    C --> D[Pour Hot Water]
    D --> E[Wait 4 Minutes]
    E --> F[Pour into Cup]
    F --> G[Enjoy]
Renders instantly in preview pane.
Cost Options: Free to Pay-Per-Use
Free Options:
- WebLLM Models: Completely free, unlimited diagrams, runs in your browser
- No costs ever
- Perfect for learning, personal projects, and unlimited practice
- Works offline after initial model download
- AI-ML API Free Tier: 10 requests per hour at no cost
- Includes 24/7 support and community access
- Covers most casual and learning needs
- Automatic—no credit card required
Pay-Per-Use (After Free Limit):
AI-ML API uses a transparent pay-per-use model when you exceed the free tier:
- Simple flowchart (10 nodes): $0.01-0.02
- Complex architecture (30+ components): $0.03-0.05
- Iteration/refinement: $0.005-0.01
Monthly cost estimates (if exceeding free tier):
- 50 diagrams/month: ~$1.50-2.50
- 200 diagrams/month: ~$6-10
- 500 diagrams/month: ~$15-25
Comparison: Far cheaper than paid diagramming tool subscriptions ($95-240/year for Lucidchart/Visio), with the added benefit of starting completely free.
Privacy and Security
According to OpenAI's API data usage policies and Anthropic's privacy policy, API requests:
- Are not used for model training
- Are not stored long-term
- Are processed server-side but not retained
Your diagram content remains private.
50+ Proven AI Prompts for Diagrams
These tested prompts produce high-quality diagrams across different types. Copy, modify, and adapt for your needs.
Flowcharts and Process Diagrams
Customer Onboarding Flow
Create a comprehensive onboarding experience with verification steps.
Create a customer onboarding flowchart with email verification, profile setup, and welcome tourEmployee Approval Workflow
Multi-level approval system with role-based authorization.
Generate an employee approval workflow with manager review, HR check, and CEO sign-off for requests over $5000Sales Pipeline Diagram
Track leads through the complete sales cycle.
Make a sales pipeline diagram from lead capture through qualification, proposal, negotiation, to closingSupport Ticket Routing
Intelligent ticket categorization and team assignment.
Design a support ticket routing flowchart that categorizes issues by severity and assigns to appropriate teamsOrder Fulfillment Process
E-commerce order processing workflow from purchase to delivery.
Create an order fulfillment process showing inventory check, payment processing, packaging, and shippingCI/CD Pipeline
Automated continuous integration and deployment workflow.
Generate a CI/CD pipeline flowchart with build, test, security scan, and deployment stagesUser Authentication Flow
Complete authentication system with security features.
Create a user authentication flow with login, password reset, 2FA, and session managementData Processing Pipeline
ETL workflow for data transformation.
Design a data processing pipeline showing ingestion, validation, transformation, and storageDeployment Decision Tree
Choose optimal deployment strategy based on requirements.
Make a deployment decision tree for choosing between rolling, blue-green, or canary deploymentsAPI Request Lifecycle
Complete request flow through application layers.
Generate an API request lifecycle flowchart from client request through middleware to responsePrinter Troubleshooting
Interactive diagnostic tree for common printer issues.
Create a troubleshooting decision tree for printer problems with 8-10 common issuesProduct Recommendation Flow
Guide users to the right product based on needs.
Design a product recommendation flowchart based on budget, features, and use caseMedical Triage System
Emergency room patient prioritization workflow.
Generate a medical triage decision tree for emergency room patient prioritizationSoftware Architecture Decision
Choose the right architecture pattern for your project.
Make a software architecture decision tree for choosing between monolith, microservices, or serverlessHiring Process Flow
Structured candidate evaluation workflow.
Create a hiring decision flowchart with screening, technical assessment, culture fit, and offer stagesArchitecture and System Diagrams
Microservices Architecture
Complete microservices system with API gateway and messaging.
Design a microservices architecture with API gateway, 5 core services (auth, users, orders, payments, notifications), message queue, and databasesCloud-Native AWS Architecture
Serverless architecture using AWS managed services.
Create a cloud-native architecture on AWS using Lambda, API Gateway, DynamoDB, S3, and CloudFrontEvent-Driven Architecture
Event sourcing system with Kafka message bus.
Generate an event-driven architecture with Kafka event bus, 4 consumer services, and event storeCQRS Architecture
Command Query Responsibility Segregation pattern.
Design a CQRS architecture showing command and query separation with separate read/write databasesSaga Pattern for Distributed Transactions
Choreography-based saga for microservices coordination.
Make a saga pattern diagram for distributed transactions across payment, inventory, and shipping servicesThree-Tier Web Application
Classic layered architecture with load balancing.
Create a three-tier web application architecture with load balancer, application servers, and database clusterHybrid Cloud Setup
On-premises to cloud connectivity architecture.
Design a hybrid cloud setup connecting on-premises datacenter to AWS with VPN and Direct ConnectKubernetes Cluster Architecture
Container orchestration infrastructure.
Generate a Kubernetes cluster architecture showing ingress, services, pods, and persistent storageServerless Data Processing
Event-driven serverless workflow orchestration.
Make a serverless data processing pipeline using AWS Step Functions coordinating Lambda functionsMulti-Region Deployment
High-availability architecture with geographic distribution.
Create a multi-region deployment architecture with active-active failover and data replicationData Warehouse Architecture
Enterprise data warehouse with ETL pipeline.
Design a data warehouse architecture with ETL pipeline, staging area, dimensional model, and BI toolsLambda Architecture
Hybrid batch and stream processing system.
Generate a lambda architecture combining batch and stream processing for real-time analyticsData Lake on Azure
Cloud-based data lake infrastructure.
Create a data lake architecture on Azure with ingestion, processing, and serving layersChange Data Capture System
Real-time database replication architecture.
Make a CDC (Change Data Capture) architecture for real-time database synchronizationML Feature Store
Machine learning feature management system.
Design a feature store architecture for ML model serving with online and offline feature computationDatabase and Data Models
E-commerce Database Schema
Complete relational database design for online store.
Create an ERD for e-commerce with entities: users, products, orders, order_items, reviews, and shopping_cartsBlog Platform Schema
Content management system database structure.
Generate a database schema for a blog platform with posts, comments, tags, categories, and user relationshipsHospital Management System ERD
Healthcare database with patient and appointment tracking.
Design an ERD for a hospital management system with patients, doctors, appointments, prescriptions, and billingLibrary Management Schema
Book tracking and lending system database.
Make a database diagram for a library system tracking books, members, loans, reservations, and finesMulti-Tenant SaaS Database
Enterprise SaaS application with organization isolation.
Create an ERD for a SaaS application with multi-tenancy, showing organizations, users, subscriptions, and usageUser Data Flow
End-to-end data processing pipeline.
Generate a data flow diagram showing user data from collection through processing to analytics dashboardLog Aggregation Pipeline
Centralized logging system architecture.
Create a data pipeline diagram for log aggregation, processing, and visualizationData Lineage Tracking
Customer data journey through systems.
Design a data lineage diagram tracking customer data from source systems to data warehouseIoT Data Streaming
Real-time sensor data processing architecture.
Make a real-time data streaming architecture from IoT sensors to analytics platformEvent Sourcing Data Flow
Microservices data synchronization pattern.
Generate a data synchronization flow between microservices using event sourcingNetwork and Infrastructure
Office Network Topology
Complete corporate network with security zones.
Create a network topology diagram for office with internet, firewall, DMZ, internal network, and serversAWS VPC Architecture
Cloud network with high availability across zones.
Design a VPC architecture on AWS with public and private subnets across 3 availability zonesHome Network Diagram
Residential network with WiFi and connected devices.
Generate a home network diagram with router, switches, WiFi access points, and connected devicesDatacenter Network Topology
Enterprise datacenter three-tier network design.
Make a datacenter network topology with core, distribution, and access layersSD-WAN Architecture
Software-defined wide area network for distributed offices.
Create a SD-WAN architecture connecting branch offices to central datacenter and cloud servicesProject Management
Software Project Gantt Chart
6-month development timeline with phases.
Generate a Gantt chart for 6-month software project with planning, development, testing, and launch phasesQ1 Milestones Timeline
Quarterly project milestones with dependencies.
Create a project timeline showing 8 milestones across Q1 with dependenciesAgile Sprint Planning
Two-week iteration workflow diagram.
Design a sprint planning diagram showing 2-week iterations with planning, daily standups, review, and retrospectiveConstruction Critical Path
Project scheduling with activity dependencies.
Make a critical path diagram for construction project with 15 activities and dependenciesResource Allocation Timeline
Team member assignments across multiple projects.
Generate a resource allocation timeline showing team members assigned to different projects over 3 monthsPrompt Engineering Masterclass
The quality of AI-generated diagrams depends heavily on prompt quality. These techniques produce consistently better results.
Anatomy of Effective Prompts
Bad prompt:
"Make a diagram for my app"Why it fails:
- No diagram type specified
- No components mentioned
- No relationships defined
- Vague context
Good prompt:
"Create a Mermaid sequence diagram showing user authentication flow with these steps:
1. User submits credentials
2. API validates credentials
3. Database checks user record
4. JWT token generated and returned
5. User redirected to dashboard"
Why it works:
- Specifies diagram type (Mermaid sequence)
- Lists components (User, API, Database)
- Defines interactions clearly
- Provides sequence order
The SPEC Framework
Use this framework for complex diagrams:
S - Specify type "Create a D2 architecture diagram..."
P - List participants "...showing frontend, API gateway, auth service, database, and cache..."
E - Explain relationships "...where frontend calls API gateway, which routes to auth service, which queries database and cache..."
C - Add constraints "...use blue for frontend components, green for backend services, and cylinders for data stores"
Adding Complexity Incrementally
Instead of one massive prompt, build diagrams iteratively:
Turn 1:
"Create a basic microservices architecture with API gateway and 3 services"Turn 2:
"Add a message queue between services for asynchronous communication"Turn 3:
"Add a caching layer and show which services use it"Turn 4:
"Add load balancers in front of each service"This approach produces better results than:
"Create a complex microservices architecture with API gateway, 3 services, message queue, caching, and load balancers all connected properly"Specifying Diagram Style and Layout
Default prompt:
"Create an org chart for a company"Styled prompt:
"Create a top-down org chart with CEO at top, 3 VPs below, and 2 managers under each VP. Use rectangles for executives and rounded rectangles for managers. Add department names as labels."The second prompt produces cleaner, more intentional output.
Handling AI Hallucinations
AI sometimes generates invalid syntax or incorrect relationships. Techniques to minimize:
1. Be explicit about constraints:
"Create a Mermaid flowchart (use only standard Mermaid syntax) showing..."2. Request validation:
"Create a GraphViz diagram and verify all node IDs are properly defined before showing connections"3. Provide examples:
"Create a sequence diagram like this example: [paste simple example]. Now make one for my use case: [your description]"4. Iterate and refine: If output has errors, reply:
"The syntax has an error on line 5. Fix it and regenerate the complete diagram"Common Prompt Patterns
Pattern 1: Component + Relationship
"Show [Component A] connecting to [Component B] through [Relationship]"
Example: "Show React frontend connecting to Node API through HTTPS requests"
Pattern 2: Process + Conditions
"Create a flow where [step 1], then if [condition], do [step 2a], else do [step 2b]"
Example: "Create a flow where user logs in, then if credentials valid, show dashboard, else show error"
Pattern 3: Hierarchy + Levels
"Design a [hierarchy type] with [level 1] at top, [level 2] below, and [level 3] at bottom"
Example: "Design an org chart with CEO at top, department heads below, and team leads at bottom"
Pattern 4: Timeline + Events
"Generate a timeline from [date] to [date] showing [event 1], [event 2], [event 3]"
Example: "Generate a project timeline from Jan to Jun showing planning, development, testing, and launch"
Advanced AI Techniques
Once comfortable with basic generation, these advanced techniques unlock more power.
Multi-Step Diagram Generation
For complex diagrams, break into phases:
Phase 1: Structure
"Create the high-level structure for a microservices architecture with 5 services. Just show services and API gateway, no details yet."Phase 2: Connections
"Now add the connections: frontend calls API gateway, API gateway routes to auth service and user service, both services connect to shared database"Phase 3: Details
"Add a Redis cache that both auth and user services use. Add a message queue for async notifications."Phase 4: Styling
"Style it: blue for frontend, green for services, red for databases, yellow for cache and queue"This produces cleaner results than one large prompt trying to specify everything.
Analyzing Existing Diagrams
AI can provide insights on diagrams you've created:
Prompt:
"Analyze this architecture diagram and suggest improvements for scalability and fault tolerance:
[paste your Mermaid/D2 code]"
AI Response:
- Identifies single points of failure
- Suggests redundancy improvements
- Recommends caching strategies
- Points out bottlenecks
Converting Between Diagram Formats
Prompt:
"Convert this Mermaid flowchart to a D2 architecture diagram with better styling:
[paste Mermaid code]"
AI understands multiple diagram languages and can translate between them, useful when switching tools or presentation contexts.
Debugging and Optimization
When diagram won't render:
"This Mermaid code has a syntax error. Find and fix it:
[paste broken code]"
When layout is messy:
"This GraphViz diagram is cluttered. Optimize the layout for better readability:
[paste DOT code]"
When style needs improvement:
"Make this diagram more professional-looking with better colors and shapes:
[paste code]"
Batch Generation
For documentation sprints:
"Generate 5 sequence diagrams for these API endpoints:
1. User registration
2. User login
3. Password reset
4. Profile update
5. Account deletion

Use consistent styling and show standard error handling in each."
AI creates all five diagrams following the same patterns, ensuring documentation consistency.
Template Creation
Prompt:
"Create a reusable template for microservice architecture diagrams that I can adapt for different services. Include placeholders for service names, databases, and external APIs."AI generates a base template you can quickly customize for multiple projects.
Real-World Use Cases
These scenarios demonstrate AI diagram generation solving actual problems.
Use Case 1: Technical Documentation Sprint
Scenario: Startup needs to document 15 microservices before investor demo (deadline: 2 days)
Traditional approach:
- 15 services × 30 minutes each = 7.5 hours of diagramming
- Plus learning time if team isn't familiar with tools
- High risk of inconsistent styling across diagrams
AI approach:
Day 1 Morning:
- Create template prompt: "Generate architecture diagram for microservice with API endpoints, database, cache, and message queue connections"
- Customize for each service (5 minutes each)
- Total: 15 services × 5 minutes = 1.25 hours

Day 1 Afternoon:
- Generate sequence diagrams for key workflows
- 10 workflows × 2 minutes = 20 minutes

Day 2:
- Review, refine, add to documentation
- Export all as SVG
- Total time saved: ~5 hours
Result: Documentation completed in 2 hours instead of 8, with consistent styling.
Use Case 2: Architecture Design Review
Scenario: Senior architect reviewing proposed system design from junior engineer
Traditional approach:
- Schedule meeting
- Junior draws on whiteboard
- Senior suggests changes
- Junior redraws
- Multiple iterations
- Junior recreates in digital tool later
AI approach:
During meeting:
Junior: "Let me generate the current design"
[Types prompt describing architecture]
AI renders instantly

Senior: "Add a caching layer here"
Junior: "Add Redis cache between API and database"
AI updates diagram in 10 seconds

Senior: "Show how this scales"
Junior: "Add load balancers and show horizontal scaling"
AI renders scaled version

Result: Real-time collaborative design with instant visualization
Outcome: What typically takes multiple meetings happens in one session.
Use Case 3: Client Presentation Preparation
Scenario: Consulting firm presenting technical solution to non-technical client stakeholders
Challenge: Need to show same system at different abstraction levels:
- High-level overview for executives
- Detailed technical view for IT team
- Data flow for compliance team
AI solution:
Prompt 1 (Executive level):
"Create a simple 5-component architecture diagram showing: User Interface, Business Logic, Database, External APIs, and Admin Panel. Use simple language and clean layout."

Prompt 2 (Technical level):
"Create detailed architecture with all 15 microservices, showing technologies used (React, Node, PostgreSQL, Redis, Kafka), deployment (Kubernetes), and monitoring (Prometheus)."

Prompt 3 (Compliance level):
"Create a data flow diagram showing how user data moves through the system, highlighting encryption points, audit logging, and data retention policies."

Time: 15 minutes total
Result: 3 tailored diagrams for different audiences
Outcome: Presentation addresses all stakeholder concerns with appropriate technical depth.
Use Case 4: Incident Documentation
Scenario: Production outage requires post-mortem documentation
Challenge: Need to quickly document what happened for incident report
AI approach:
Prompt:
"Create a sequence diagram showing this incident timeline:
1. 14:23 - User reports slow API responses
2. 14:25 - Monitoring detects database connection pool exhaustion
3. 14:27 - Database CPU hits 100%
4. 14:30 - Auto-scaling triggers
5. 14:35 - New database replicas online
6. 14:37 - Connection pool restored
7. 14:40 - Performance normal

Show which components were affected at each step."
Result: Clear visual timeline for post-mortem within 2 minutes, meeting incident documentation requirements from Google's SRE book on incident management.
Use Case 5: Learning and Training
Scenario: New developer onboarding, needs to understand complex system
Traditional approach:
- Read documentation (often outdated)
- Ask senior developers (interrupts their work)
- Try to piece together understanding
AI approach:
New developer asks AI:
"Explain the authentication system and show me a diagram"

AI generates:
1. Sequence diagram of auth flow
2. Architecture diagram of auth service
3. State diagram of session lifecycle

Developer asks follow-ups:
"Show what happens when token expires"
"Diagram the password reset flow"
"Show how refresh tokens work"

Result: Self-service learning with visual aids
Limitations and Best Practices
While AI diagram generation is powerful, understanding limitations ensures realistic expectations and better results.
Current Limitations
1. Complex Spatial Reasoning AI struggles with precise positioning requirements. For diagrams needing exact spatial relationships (like detailed floor plans or circuit diagrams), manual tools remain superior.
2. Domain-Specific Notation Specialized notations (like electrical engineering symbols or chemical structures) may require manual creation or validation.
3. Iterative Refinement Limits After 5-6 iterations, AI may lose context or introduce inconsistencies. For extensive revisions, starting fresh often works better.
4. Syntax Edge Cases AI occasionally generates valid-looking but technically incorrect syntax. Always preview and test generated diagrams.
5. No Visual Feedback Loop AI doesn't "see" the rendered output. It can't say "move this node 3 pixels left" because it works purely with code.
Best Practices
1. Start Simple, Add Complexity Generate basic structure first, then enhance iteratively. This produces cleaner results than complex initial prompts.
2. Validate Technical Accuracy AI generates structurally correct diagrams but may misunderstand domain specifics. Review technical details carefully.
3. Use Specific Terminology Industry-standard terms produce better results than colloquial descriptions.
Bad: "Make boxes for the computer things" Good: "Create nodes for web server, application server, and database"
4. Specify Diagram Type Explicitly Always mention the target format:
- "Create a Mermaid flowchart..."
- "Generate a D2 architecture diagram..."
- "Make a GraphViz network graph..."
5. Provide Examples for Complex Patterns For unusual diagram types, show AI an example first:
"Here's an example of the diagram style I want:
[paste example]

Now create a similar diagram for: [your use case]"
6. Version Control Your Prompts Save successful prompts for reuse. Build a personal prompt library for common diagram types.
7. Combine AI with Manual Refinement Use AI for 80% of work (structure, connections), manual tools for 20% (fine positioning, specialized styling).
8. Test in Target Environment If diagrams are for GitHub, test rendering there. Different platforms have slight Mermaid version differences.
When to Use AI vs Manual Tools
Use AI for:
- Standard diagram types (flowcharts, sequence, architecture)
- Initial drafts and prototypes
- Documentation at scale (10+ diagrams)
- Learning new diagram syntaxes
- Consistent styling across many diagrams
Use manual tools for:
- Pixel-perfect positioning requirements
- Highly specialized notations
- Artistic/creative diagrams
- One-off presentation graphics
- Diagrams with photos or custom images
Hybrid approach works best: AI for structure, manual refinement for polish.
Future of AI-Powered Diagramming
AI diagram generation is evolving rapidly. Emerging capabilities will transform technical documentation further.
Near-Term Innovations (2025-2026)
Visual Feedback Loop Next-generation AI will "see" rendered output and make positioning suggestions:
AI: "The database node overlaps with the API node. Should I adjust spacing?"Diagram-to-Code Reverse Engineering Upload screenshots of diagrams, AI generates equivalent code:
User: [uploads whiteboard photo]
AI: "Here's the Mermaid code for your whiteboard diagram"
Real-Time Collaboration Multiple users describe diagram changes simultaneously, AI merges contributions intelligently.
Domain-Specific Training AI models fine-tuned for industries (healthcare, finance, manufacturing) producing specialized diagrams with correct notation and compliance.
Mid-Term Evolution (2026-2027)
Multimodal Generation
"Show me the current system architecture"
AI: [generates diagram]
"Now explain the data flow verbally"
AI: [generates diagram + audio explanation]
"Create documentation with both"
AI: [generates markdown with embedded diagrams and text]
Automated Diagram Maintenance AI monitors code repositories, automatically updates architecture diagrams when code structure changes. This aligns with continuous documentation principles from the Write the Docs community.
Predictive Diagramming
"I'm designing a payment processing system"
AI: "Based on PCI compliance requirements and best practices, here's the recommended architecture [generates diagram]. This pattern handles 10,000 TPS and includes fraud detection."
Long-Term Vision (2027+)
Interactive Documentation Diagrams that update in real-time as you ask questions:
"What happens if the database fails?"
[Diagram highlights redundancy, failover paths animate]

"Show me load under peak traffic"
[Diagram shows scaling, traffic flows adjust]
AI as Architecture Advisor
"Review my architecture and identify problems"
AI: [analyzes diagram, generates report]
"Problem 1: Single point of failure at API gateway
Problem 2: Database not horizontally scalable
Problem 3: No caching layer

Would you like me to generate improved architecture?"
Natural Language to Full Documentation
"Document our e-commerce system"
AI: [generates 20 diagrams, technical documentation, API specs, all cross-referenced]
Preparing for AI-First Workflows
Skills to develop now:
- Prompt engineering: Better prompts = better diagrams
- Diagram syntax basics: Understand what AI generates
- Architecture patterns: Know what to ask for
- Documentation-as-code: Version control diagrams with code
Organizations should:
- Adopt text-based diagram tools (Mermaid, D2, GraphViz)
- Integrate diagrams into Git workflows
- Train teams on AI-assisted documentation
- Build prompt libraries for common diagram types
Research from McKinsey on AI productivity suggests AI tools increase documentation productivity by 40-60%, with diagramming being a prime candidate for automation.