
GraphViz Online - DOT Editor for Network Diagrams & Graphs
Network diagrams, dependency graphs, and organizational charts require precision that traditional drag-and-drop tools can't deliver. GraphViz solves this with automatic layout algorithms that transform text-based DOT language into perfectly structured visualizations.
At tools-online.app, we've built a free, browser-based GraphViz DOT editor that gives you the power of professional graph visualization without installing software. Whether you're mapping code dependencies, designing network topologies, or creating organizational hierarchies, GraphViz handles complexity that other tools struggle with.
This guide shows you exactly how to use GraphViz online, when to choose it over alternatives like Mermaid or D2, and how to create production-ready diagrams in minutes.
Table of Contents
What is GraphViz and Why Use It Online?
GraphViz (Graph Visualization Software) is an open-source tool developed at AT&T Labs that uses the DOT language to represent graphs as structured text. The official GraphViz documentation describes it as a way to represent structural information as diagrams of abstract graphs and networks.
Unlike manual diagramming tools, GraphViz automatically calculates optimal node positions using sophisticated algorithms from graph theory. This makes it ideal for:
- Code dependency analysis - Visualize how modules, classes, or functions depend on each other
- Network topology diagrams - Map servers, routers, and network infrastructure
- Organizational charts - Display company hierarchies and reporting structures
- State machines - Document system states and transitions
- Data flow diagrams - Show how data moves through systems
Why use GraphViz online? Our browser-based editor eliminates installation complexity while providing:
- Live preview - See your diagram render in real-time as you type
- Multiple layout engines - Switch between hierarchical, circular, and force-directed layouts
- Instant export - Download SVG, PNG, or copy source code
- AI assistance - Generate DOT code from natural language descriptions
- No setup required - Start creating diagrams immediately
For a complete overview of all diagramming options, see our Online Diagram Tools Guide.
Getting Started: GraphViz DOT Syntax Basics
The DOT language uses simple syntax to define nodes and edges (connections). Here's your first GraphViz diagram:
digraph G {
    A -> B;
    B -> C;
    A -> C;
}This creates a directed graph with three nodes (A, B, C) and three edges showing relationships. The code appears on the left, and the rendered diagram displays on the right.
Key DOT Language Concepts
Graph Types:
digraph- Directed graph (arrows show direction)graph- Undirected graph (simple connections)
Basic Syntax:
digraph MyGraph {
    // Nodes
    Node1 [label="Display Name"];
    Node2 [shape=box, color=blue];

    // Edges
    Node1 -> Node2 [label="connection"];
}
Common Node Shapes: According to the DOT language specification, GraphViz supports over 50 shapes including: box, circle, ellipse, diamond, cylinder, rectangle, hexagon, and more.
The GraphViz Node Shapes documentation provides comprehensive shape references for specialized diagram needs.
Ready-to-Use GraphViz Templates
The Graphviz editor on tools-online.app includes pre-built templates for common workflows.Start with these professional templates - click any link to open the live editor with code and preview:
1. Simple Directed Graph
Basic graph showing directional relationships between nodes. Perfect for visualizing simple dependencies or process flows.
2. Flowchart Diagram
Traditional flowchart with decision points and process boxes. Use for documenting algorithms or business processes.
3. Organizational Chart
Hierarchical structure showing reporting relationships. Ideal for company org charts or project team structures.
4. Network Diagram
Network topology showing servers, routers, and connections. Perfect for IT infrastructure documentation.
5. State Machine
State transition diagram with conditions. Use for documenting system behavior or workflow states.
6. Entity Relationship Diagram
Database schema with table relationships. Shows primary keys, foreign keys, and entity connections.
7. Dependency Graph
Module and package dependencies. Visualize how code components depend on each other.
8. Circular Layout
Nodes arranged in a circle. Useful for peer relationships or cyclical processes.
9. Subgraphs and Clusters
Grouped nodes with visual boundaries. Perfect for showing system components or team structures.
GraphViz Layout Engines: Choosing the Right Algorithm
GraphViz's power comes from its layout engines - algorithms that automatically position nodes. According to the GraphViz Layout Manual, each engine optimizes for different graph structures:
dot - Hierarchical layouts for directed graphs Best for: Flowcharts, organizational charts, dependency trees Creates: Top-to-bottom or left-to-right hierarchies
neato - Spring model layouts using force-directed placement Best for: Undirected graphs, social networks Creates: Natural-looking node distributions
fdp - Force-directed placement for large graphs Best for: Network diagrams with many connections Creates: Minimized edge crossings
circo - Circular layouts Best for: Cyclic structures, peer relationships Creates: Nodes arranged in circles
twopi - Radial layouts with central node Best for: Hub-and-spoke topologies, star networks Creates: Nodes radiating from center
sfdp - Scalable force-directed placement Best for: Very large graphs (1000+ nodes) Creates: Efficient layouts for massive datasets
When to Use Each Engine
// Hierarchical (use dot)
digraph { rankdir=TB; A -> B -> C; }

// Circular (use circo)
graph { layout=circo; A -- B -- C -- D -- A; }

// Network (use fdp)
graph { layout=fdp; node [shape=circle];
  Server1 -- Router -- Server2;
}
For more complex layout examples, see our complete diagram tools comparison.
5 Real-World GraphViz Use Cases
1. Software Dependency Analysis
Map how your codebase modules depend on each other. GraphViz automatically untangles complex dependencies into readable hierarchies.
digraph dependencies {
    rankdir=LR;
    node [shape=box];

    "main.py" -> "auth.py";
    "main.py" -> "database.py";
    "auth.py" -> "utils.py";
    "database.py" -> "utils.py";
}
Use with Code Compare to track how dependencies change over time.
2. Network Infrastructure Documentation
Document your IT infrastructure with precise topology diagrams. The IEEE 802 standards recommend visual documentation for network architectures.
graph network {
    layout=fdp;
    node [shape=box];

    Internet -- Firewall;
    Firewall -- Router;
    Router -- {Server1 Server2 Server3};
    Server1 -- Database;
}
3. API Request Flow
Visualize how API requests flow through your system. Perfect for onboarding documentation and architecture reviews.
digraph api_flow {
    rankdir=LR;

    Client -> "API Gateway" -> Auth;
    Auth -> "Business Logic";
    "Business Logic" -> Database;
    "Business Logic" -> Cache;
}
Combine with Mermaid sequence diagrams for detailed interaction flows.
4. Database Schema Relationships
Map complex database relationships with foreign keys and indexes. The Entity-Relationship Model concept was formalized in database theory.
digraph schema {
    node [shape=record];

    Users [label="Users|id|email|password"];
    Orders [label="Orders|id|user_id|total"];
    Items [label="Items|id|order_id|product"];

    Orders -> Users [label="user_id"];
    Items -> Orders [label="order_id"];
}
5. System State Machines
Document how systems transition between states. Based on finite state machine theory from computer science.
digraph states {
    rankdir=LR;
    node [shape=circle];

    Idle -> Processing [label="start"];
    Processing -> Complete [label="success"];
    Processing -> Error [label="failure"];
    Error -> Idle [label="retry"];
}
AI-Powered GraphViz Diagram Generation
Creating complex DOT syntax manually can be tedious. Our AI Diagram Assistant generates complete GraphViz code from natural language descriptions.
How to Use AI for GraphViz Diagrams
Step 1: Configure AI (one-time setup)
- Get your API key from AIML API
- Click "Settings" icon(located lower left) in any tools-online.app tool.
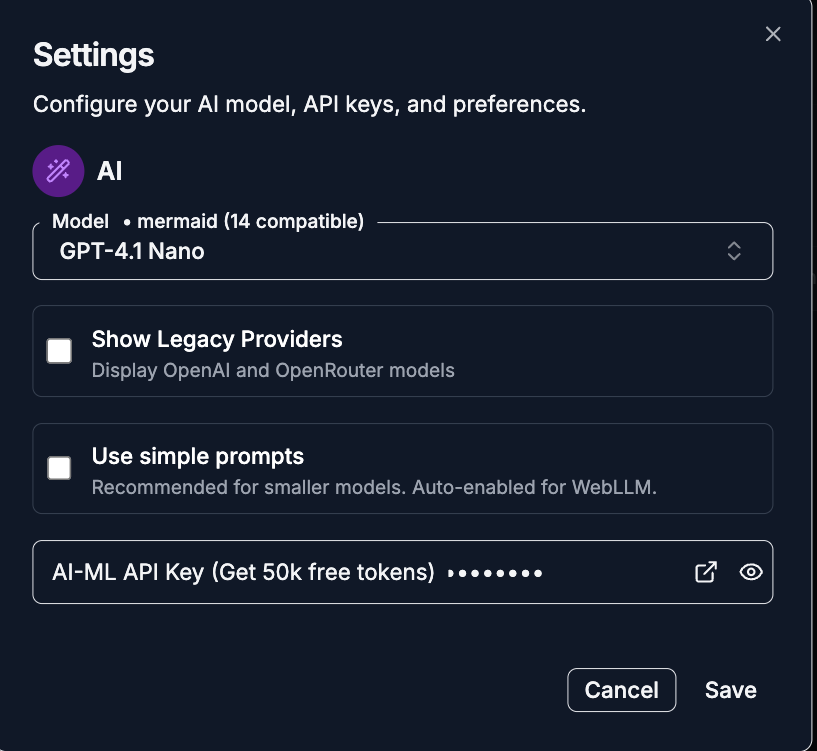
- Add API key and save.
.png)
Step 2: Open AI Chat
- Click the AI Chat button(located lower left)
.png)
- Choose "Generate" mode and provide a natural language description for the diagram.
.png)
Step 3: Describe your diagram in plain English
Example Prompts:
- "Create a network diagram with 3 servers connected to a router and firewall"
- "Generate an organizational chart for a company with CEO, 3 VPs, and 5 managers"
- "Make a dependency graph showing how Python modules import each other"
- "Design a state machine for a login system with idle, authenticating, and logged-in states"
The AI generates complete DOT code that you can immediately render, modify, and export.
For more AI diagramming capabilities, see our comprehensive AI Integration Guide and learn how AI enhances diagram scripting.
GraphViz vs Mermaid vs D2: When to Choose Each
Choosing the right tool depends on your specific needs:
Use GraphViz when you need:
- Complex network analysis with 100+ nodes
- Automatic graph layout algorithms
- Mathematical precision in node placement
- Dependency visualization
- Large-scale hierarchical structures
Use Mermaid when you need:
- Quick documentation diagrams
- GitHub-native rendering
- Simple flowcharts and sequence diagrams
- Minimal syntax and fast learning curve
Use D2 when you need:
- Architecture and infrastructure diagrams
- Manual control over positioning
- Modern, professional styling
- Cloud system design (AWS, Azure, GCP)
Feature Comparison:
Feature Comparison
| Feature | GraphViz | Mermaid | D2 |
| Learning Curve | Medium | Easy | Medium |
| Layout Control | Automatic | Automatic | Manual + Auto |
| Max Complexity | 1000+ nodes | ~50 nodes | ~200 nodes |
| Best For | Networks, Dependencies | Docs, Wikis | Architecture |
| GitHub Native | No | Yes | No |
| Export Quality | Excellent | Good | Excellent |
For complete tool comparisons, read our Best Free Diagram Editors Guide.
Working with the GraphViz Editor
Our online GraphViz editor provides a professional environment for creating diagrams:
Key Features:
Live Preview - See diagrams render in real-time as you type DOT code
File Operations:
- Open DOT files from your computer
- Save diagrams to local storage
- Import existing GraphViz projects
Export Options:
- SVG - Scalable vector graphics (best for web and print)
- PNG - Raster image (universal compatibility)
- Source Code - Copy DOT code for version control
- Copy as Image - Direct clipboard copy for quick sharing
Editor Tools:
- Syntax highlighting
- Undo/redo support
- Code formatting
- Error detection
Layout Engine Selection - Switch between dot, neato, fdp, circo, twopi, and sfdp layouts with one click
All processing happens client-side in your browser - your diagrams never leave your device. Learn more about our privacy-first approach.
Best Practices for GraphViz Diagrams
1. Choose the Right Layout Engine Match the engine to your graph structure. Use dot for hierarchies, fdp for networks, and circo for cyclic relationships.
2. Use Meaningful Node Labels
// Good
"AuthService" [label="Authentication\nService"];

// Avoid
A [label="A"];
3. Group Related Nodes with Subgraphs
subgraph cluster_frontend {
    label="Frontend";
    React; Redux; Router;
}
4. Apply Consistent Styling Define node and edge styles at the graph level for visual consistency.
5. Keep Graphs Focused If your diagram has more than 50 nodes, consider breaking it into multiple views or using the sfdp engine.
6. Version Control Your DOT Files Store diagrams as .dot files in your repository alongside code. Use Code Compare to track changes.
7. Document Complex Graphs Add comments to explain non-obvious relationships:
// User authentication flow
User -> Auth [label="credentials"];
Common GraphViz Questions
Can I use GraphViz for large networks with 500+ nodes? Yes. Use the sfdp layout engine designed for scalable force-directed placement. It handles thousands of nodes efficiently.
How do I create horizontal layouts instead of vertical? Add rankdir=LR; (left-to-right) to your digraph. Options are TB (top-bottom), BT (bottom-top), LR (left-right), or RL (right-left).
Can I embed images in nodes? Yes. Use the image attribute:
Node1 [image="icon.png", label=""];How do I export high-resolution diagrams? Export as SVG for infinite scalability. SVG files remain crisp at any resolution and work in all modern browsers and design tools.
Can I use GraphViz with CI/CD pipelines? Yes. Generate diagrams automatically on code commits. Store DOT files in your repo and use automation tools to render updated diagrams. Integrate with JSON or YAML tools for configuration-based diagram generation.
Next Steps: Master GraphViz Diagramming
Ready to create professional network diagrams and dependency graphs?
Start Creating:
- Open GraphViz Editor - Start with ready-made templates
- Try AI Diagram Generation - Generate DOT code from descriptions
Learn More:
- Complete Diagram Tools Guide - Explore all diagramming options
- Mermaid Editor - For simpler flowcharts
- D2 Editor - For architecture diagrams
- Gnuplot Editor - For data visualization
Related Tools:
- Code Compare - Track diagram changes
- JSON Tool - Process structured data
- Markdown Editor - Document your diagrams
GraphViz transforms complex relationships into clear visual structures. Whether you're analyzing codebases, documenting networks, or designing systems, our free online editor gives you professional graph visualization without installation hassles.
Have questions or need help? All tools on tools-online.app are completely free with no account required. Start creating network diagrams today.