
D2 Diagrams Online Complete Architecture Diagram Guide
Table of Contents
What is D2 Diagram Language?
D2 (Declarative Diagramming) is an open-source diagram scripting language created by Terrastruct specifically for software engineers, architects, and DevOps teams who need to create professional technical diagrams without manual drag-and-drop work.
Why D2 Was Created
Traditional diagramming tools like Lucidchart, Visio, and Draw.io require:
- Manual positioning of every element
- Constant alignment adjustments
- Time-consuming export/import workflows
- Difficult version control
- Poor collaboration across teams
D2 solves these problems by letting you describe your architecture in code and automatically generating professional layouts.
Key Advantages of D2
1. Declarative Syntax
You describe what you want, not how to position it. D2's layout engine handles the visual arrangement automatically.
2. Version Control Friendly Store D2 files in Git alongside your code. Track changes, review diffs, and collaborate using standard development workflows recommended by Git's official documentation.
3. Modern Shape Library Unlike older tools, D2 includes shapes specifically designed for modern architectures:
- Hexagons for API gateways
- Cylinders for databases
- Persons for users/actors
- Clouds for cloud services
- Rectangles for services/components
4. Smart Layout Algorithms D2 automatically positions elements to minimize crossing lines and optimize readability—something that takes hours manually in traditional tools.
D2 vs Mermaid vs GraphViz
Choosing between D2, Mermaid, and GraphViz depends on your specific use case. Here's an honest comparison:
Feature Comparison Table
| Feature | D2 | Mermaid | GraphViz |
| Best For | Architecture diagrams | Documentation flowcharts | Dependency graphs |
| Learning Curve | 15 min | 5 min | 30 min |
| Shape Variety | Excellent (8+ types) | Limited (4 types) | Basic (3 types) |
| Layout Control | Good (containers, grids) | Minimal | Excellent (multiple algorithms) |
| GitHub Native | No (SVG export) | Yes | No (SVG export) |
| Styling Options | Advanced (colors, borders, fonts) | Basic | Basic |
| Large Diagrams (50+ nodes) | Good | Slows down | Excellent |
| Cloud/Infra Shapes | Perfect | Limited | None |
| Database ERD | Yes | Yes | Possible but clunky |
| AI Generation | Yes (tools-online.app) | Yes (tools-online.app) | Yes (tools-online.app) |
When to Choose D2 Over Alternatives
Choose D2 when:
- You're documenting microservices or distributed systems
- You need professional-looking diagrams for clients/stakeholders
- You want precise control over shapes and styling
- You're building cloud infrastructure diagrams (AWS/Azure/GCP)
- You need to embed diagrams in technical documentation
Choose Mermaid when:
- You need native GitHub rendering in README files
- You're creating simple flowcharts or sequence diagrams
- You want the absolute fastest syntax (5-minute learning curve)
- Your diagrams have fewer than 20 nodes
Choose GraphViz when:
- You're visualizing large dependency graphs (100+ nodes)
- You need mathematical precision in graph layouts
- You're analyzing code structure or network topology
- Shape variety doesn't matter
Related: See our complete comparison of all diagram tools on tools-online.app
Step-by-Step Tutorial: Create Your First D2 Diagram
Let's build a diagram from scratch.
What We're Building
A modern e-commerce backend with:
- User-facing API gateway
- Authentication service
- Order processing service
- Payment service
- Notification service
- Three databases
- Message queue for async communication
Step 1: Open the D2 Editor
- Clear any existing code
- You'll see a split view: code editor (left) and live preview (right)
Step 2: Define the Basic Structure
Start by declaring all services:
# E-commerce Microservices Architecture
direction: right

users: Users
api: API Gateway
auth: Auth Service
orders: Order Service
payments: Payment Service
notifications: Notification Service
What this does: Creates 6 rectangles. The direction: right makes the layout flow horizontally.
Step 3: Add Custom Shapes
Make it look professional by using appropriate shapes:
users: Users { shape: person }
api: API Gateway { shape: hexagon }
auth: Auth Service
orders: Order Service
payments: Payment Service
notifications: Notification Service
Step 4: Add Databases
db: Databases {
  users_db: Users DB { shape: cylinder }
  orders_db: Orders DB { shape: cylinder }
  payments_db: Payments DB { shape: cylinder }
}
Step 5: Add Message Queue
queue: Message Queue {
  order_queue: Order Events { shape: oval }
  notification_queue: Notification Events { shape: oval }
}
Step 6: Connect Everything
# User to API
users -> api: HTTP/REST

# API to Services
api -> auth: authenticate
api -> orders: create order
api -> payments: process payment

# Services to Databases
auth -> db.users_db: verify credentials
orders -> db.orders_db: store order
payments -> db.payments_db: record transaction

# Async Communication
orders -> queue.order_queue: publish event
queue.order_queue -> notifications: consume event
notifications -> queue.notification_queue: email/SMS
Step 7: Add Styling (Optional)
# Color-code by layer
users.style.fill: "#e3f2fd"
api.style.fill: "#fff3e0"
auth.style.fill: "#f3e5f5"
orders.style.fill: "#f3e5f5"
payments.style.fill: "#f3e5f5"
notifications.style.fill: "#f3e5f5"
Step 8: Export Your Diagram
- Click "Export SVG" for scalable vector format (best for documentation)
- Or click "Export PNG" for raster images (presentations, Slack)
- Or "Copy to Clipboard" for quick sharing
Complete Code
# E-commerce Microservices Architecture
direction: right

users: Users { shape: person }
api: API Gateway { shape: hexagon }

# Services
auth: Auth Service
orders: Order Service
payments: Payment Service
notifications: Notification Service

# Databases
db: Databases {
  users_db: Users DB { shape: cylinder }
  orders_db: Orders DB { shape: cylinder }
  payments_db: Payments DB { shape: cylinder }
}

# Message Queue
queue: Message Queue {
  order_queue: Order Events { shape: oval }
  notification_queue: Notification Events { shape: oval }
}

# Connections
users -> api: HTTP/REST
api -> auth: authenticate
api -> orders: create order
api -> payments: process payment

auth -> db.users_db: verify credentials
orders -> db.orders_db: store order
payments -> db.payments_db: record transaction

orders -> queue.order_queue: publish event
queue.order_queue -> notifications: consume event
notifications -> queue.notification_queue: email/SMS
Try it now: Paste this code into D2 Editor and see it render instantly.
When to Use D2 Diagrams
1. Microservices Architecture D2 excels at showing service relationships, API boundaries, and data flows in distributed systems.
Example scenario: E-commerce platform with 8 microservices, message queues, and multiple databases.
2. Cloud Infrastructure Diagrams Document AWS, Azure, or GCP architectures with proper shapes for load balancers, storage, compute, and networking.
Example scenario: 3-tier web application with EC2 instances, RDS, S3, CloudFront, and VPC configuration.
3. Database Schema (ERD) Visualize entity relationships, foreign keys, and table structures using cylinder shapes for databases.
Example scenario: SaaS application with users, subscriptions, payments, and audit logging tables.
4. System Design Interviews Quickly sketch architecture decisions during technical interviews or design discussions.
Example scenario: Design a URL shortener service showing cache layers, database sharding, and CDN integration.
5. Technical Documentation Embed architecture diagrams in Confluence, Notion, or internal wikis alongside written documentation.
Example scenario: Onboarding documentation showing how different services communicate in your tech stack.
6. DevOps Pipelines Visualize CI/CD workflows, deployment strategies, and infrastructure-as-code relationships.
Example scenario: GitOps workflow showing Git repos, Jenkins pipelines, Kubernetes clusters, and monitoring.
When NOT to Use D2
Use Mermaid instead for:
- Simple flowcharts in GitHub README files (Mermaid renders natively)
- Quick sequence diagrams for API documentation
- Gantt charts for project timelines
Use GraphViz instead for:
- Large dependency graphs with 100+ nodes
- Automatic hierarchical layouts for org charts
- Mathematical graph theory visualizations
Use traditional tools (Lucidchart, Figma) for:
- Pixel-perfect marketing materials
- Highly customized visual designs
- Presentations requiring animation
- Non-technical stakeholders who prefer drag-and-drop
D2 Syntax Basics
D2 syntax is designed to be intuitive for developers. If you've written configuration files or used any programming language, you'll pick it up in minutes.
1. Nodes (Shapes)
The simplest D2 diagram is just declaring nodes:
users
api
database
This creates three rectangles with labels. By default, everything is a rectangle.
2. Connections (Arrows)
Connect nodes with ->:
users -> api
api -> database
Result: Arrows flow from users to API to database with automatic layout.
3. Labels on Connections
Add descriptive text to arrows:
users -> api: HTTP requests
api -> database: SQL queries
4. Custom Shapes
D2 supports multiple shape types:
users: Users { shape: person }
api: API Gateway { shape: hexagon }
cache: Redis { shape: cylinder }
cloud: AWS { shape: cloud }
decision: Route { shape: diamond }
storage: S3 { shape: oval }
Available shapes:
rectangle(default)hexagon- perfect for gateways, routerscylinder- databases, caches, storageperson- users, actorsdiamond- decision pointsoval- storage, bucketscloud- cloud services
5. Containers (Grouping)
Group related elements with curly braces:
backend: Backend Services {
  auth: Auth Service
  orders: Order Service
  payments: Payment Service
}

database: Databases {
  users_db: Users DB { shape: cylinder }
  orders_db: Orders DB { shape: cylinder }
}

backend.auth -> database.users_db
backend.orders -> database.orders_db
backend.payments -> database.orders_db
Result: Visual grouping with clear boundaries between subsystems.
6. Styling
Customize colors, borders, and fonts:
users: Users {
  shape: person
  style: {
    fill: "#e3f2fd"
    stroke: "#1976d2"
    font-color: "#0d47a1"
  }
}

api: API Gateway {
  shape: hexagon
  style: {
    fill: "#fff3e0"
    stroke: "#f57c00"
    stroke-width: 3
  }
}
7. Bidirectional Connections
Use <-> for two-way communication:
api <-> cache: Read/Write8. Multiple Connections
One node can connect to many:
api -> auth_service
api -> order_service
api -> payment_service
api -> notification_service
Pro Tip: D2 automatically arranges these to minimize crossing lines.
D2 Diagram Templates: Ready to Use
The D2 editor on tools-online.app includes pre-built templates for common architecture patterns. Below are the available templates—click any template to instantly view both its rendered diagram and corresponding code. For instance, clicking the Basic Flow below will display the visual diagram alongside its D2 code in D2 editor on tools-online.app .
1. Basic Flow
Simple linear workflow with 3-5 steps. Perfect for getting started.
Use cases:
- Simple data pipelines
- Basic request/response flows
- Quick proof-of-concepts
2. Microservices Architecture
Multi-service system with API gateway, services, and databases.
Use cases:
- Distributed applications
- Service mesh visualization
- Backend architecture documentation
3. Network Infrastructure
Network topology showing servers, switches, routers, and connections.
Use cases:
- IT infrastructure diagrams
- Network security architecture
- Data center layouts
4. CI/CD Pipeline
DevOps workflow from code commit to production deployment.
Use cases:
- Deployment documentation
- Pipeline optimization
- Team onboarding
5. Database Relationships
Entity-relationship diagram (ERD) showing tables and foreign keys.
Use cases:
- Schema design
- Database documentation
- Data modeling
6. Organizational Chart
Hierarchical structure showing reporting relationships.
Use cases:
- Company structure
- Team organization
- Project hierarchy
7. AWS Cloud Architecture
Cloud infrastructure with EC2, RDS, S3, and networking.
Use cases:
- Cloud deployment diagrams
- Cost optimization planning
- Disaster recovery design
8. API Design Patterns
REST API architecture with endpoints, auth, and data flow.
Use cases:
- API documentation
- Integration planning
- Developer onboarding
How to use templates:
- Open D2 Editor
- Click "Samples" button in toolbar
- Select a template from the sidebar
- Customize the code for your needs
- Export when ready
AI-Powered D2 Diagram Generation
The D2 editor on tools-online.app includes an AI diagram assistant that generates complete D2 code from natural language descriptions.
How to Use AI Generation
Step 1: Configure AI (one-time setup)
- Get your API key from AIML API
- Click "Settings" icon(located lower left) in any tools-online.app tool.
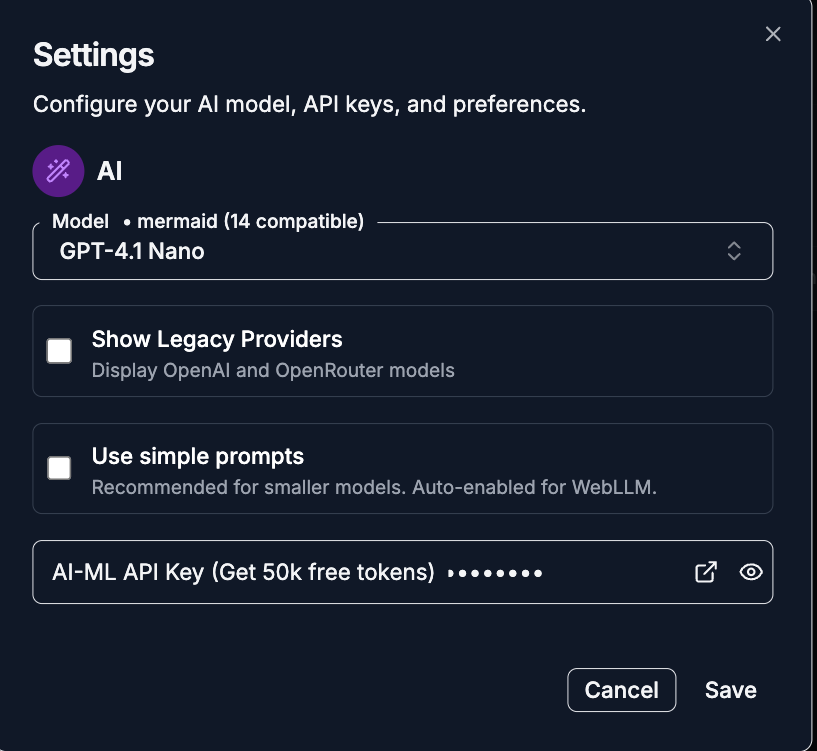
- Add API key and save.
.png)
Step 2: Open AI Chat
- Click the AI Chat button(located lower left)
.png)
- Choose "Generate" mode and provide a natural language description for the diagram.
.png)
Step 3: Describe Your Diagram
Type what you need in plain English. Examples:
Simple request:
Create a microservices architecture with API gateway,
authentication service, user service, and PostgreSQL database.
Complex request:
Generate an AWS cloud infrastructure diagram showing:
- Application Load Balancer
- Three EC2 instances in an Auto Scaling group
- RDS MySQL database with read replica
- S3 bucket for static assets
- CloudFront CDN
- All components in a VPC with public and private subnets
Event-driven system:
Design an event-driven architecture with:
- Order service that publishes to Kafka
- Inventory service that consumes order events
- Payment service triggered by inventory events
- Notification service sends emails/SMS
- Show message queue between services
Step 4: Review and Refine
The AI generates complete D2 code. You can:
- Click "Apply" to use the code as-is
- Ask for modifications: "Make the databases blue" or "Add a cache layer"
- Manually edit the generated code
AI Prompt Best Practices
Be specific about:
- Number of components (e.g., "three microservices")
- Types of connections (e.g., "async via message queue")
- Technology stack (e.g., "PostgreSQL database" not just "database")
- Layout preference (e.g., "arrange horizontally")
Good prompts:
- "Create a 3-tier web app with load balancer, app servers, and MySQL"
- "Design a CI/CD pipeline from GitHub to Kubernetes"
- "Show a payment flow with user, API, payment gateway, and bank"
Vague prompts (less effective):
- "Make a system diagram"
- "Show my architecture"
- "Create something for microservices"
AI Limitations
The AI assistant is powerful but has constraints:
- Great for standard patterns (microservices, 3-tier, event-driven)
- Good at generating initial structure quickly
- May need manual styling adjustments for colors/fonts
- Best for 5-20 components (larger diagrams need human refinement)
- Cannot access your existing codebase (you describe it)
Learn more: AI Diagram Generator - Create Diagrams from Text Prompts
Export and Integration Options
Export Formats
The D2 editor on tools-online.app supports three export formats:
1. SVG (Recommended for Documentation)
When to use:
- Technical documentation (Confluence, Notion, GitHub)
- Websites and wikis
- Any place where scaling matters
2. PNG (Best for Presentations)
When to use:
- PowerPoint or Google Slides
- Chat tools (Slack, Teams, Discord)
- Email attachments
- Quick sharing where compatibility matters
3. Copy to Clipboard
When to use:
- Instant sharing in chat
- Quick paste into documents
- Rapid iteration during meetings
Best Practices for Architecture Diagrams
1. Keep Diagrams Focused
Bad approach: One massive diagram showing entire system (50+ components)
Good approach: Multiple focused diagrams:
- High-level overview (5-10 components)
- Service-level details (per microservice)
- Data flow diagrams (specific user journeys)
- Infrastructure diagrams (deployment view)
Rule of thumb: 15-20 components maximum per diagram.
2. Use Consistent Naming
Bad:
auth_service
orderService
Payment-Service
notif_svc
Good:
auth_service
order_service
payment_service
notification_service
Pick a convention:
snake_case(recommended for D2)kebab-casecamelCase
Stick to it throughout all diagrams.
3. Label Connections Meaningfully
Bad:
api -> databaseGood:
api -> database: SELECT users WHERE id = ?Or:
api -> database: Read (100 QPS avg)Labels should answer: "What data/action flows through this connection?"
4. Color Code by Layer/Type
Use colors to group related components:
# Frontend - Blue
web_app.style.fill: "#e3f2fd"
mobile_app.style.fill: "#e3f2fd"

# API Layer - Orange
api_gateway.style.fill: "#fff3e0"

# Services - Purple
auth_service.style.fill: "#f3e5f5"
order_service.style.fill: "#f3e5f5"

# Data - Green
database.style.fill: "#e8f5e9"
cache.style.fill: "#e8f5e9"
5. Add Context in Comments
D2 supports comments with #:
# Production Architecture - Updated Jan 2025
# Total capacity: 10,000 req/sec
# Disaster recovery: Active-passive

users -> api: HTTPS/TLS 1.3
Comments don't render but help future maintainers.
6. Version Your Diagrams
Include version info:
title: E-Commerce Architecture v2.1 {
  near: top-center
  style.font-size: 20
  style.bold: true
}

subtitle: Last Updated: Jan 15, 2025 {
  near: top-center
}
7. Link to Documentation
Add references in comments:
# See: https://wiki.company.com/architecture
# Runbook: https://runbooks.company.com/api-gateway
# SLA: 99.9% uptime

api_gateway -> services
Troubleshooting Common D2 Issues
Issue 1: Connections Overlapping or Crossing
Symptom: Lines cross each other making diagram hard to read.
Solution 1 - Change Direction:
direction: right # or left, up, downSolution 2 - Use Containers: Group related items to force spatial separation.
Solution 3 - Explicit Positioning:
api.near: top-center
database.near: bottom-center
Issue 2: Text Labels Too Long
Symptom: Node labels overflow or get truncated.
Solution - Use Line Breaks:
service: "Authentication\nService"Or abbreviate:
service: Auth SvcIssue 3: Diagram Too Wide/Tall
Symptom: Output image is too large for documentation.
Solution - Grid Layout:
grid-columns: 3 # Force 3-column gridOr export at lower resolution:
- Export PNG at 1200px instead of 2400px
Issue 4: Colors Not Showing
Symptom: Custom colors don't apply.
Solution - Check Syntax:
# Wrong
service.style.fill: #e3f2fd

# Correct (needs quotes)
service.style.fill: "#e3f2fd"
Issue 5: Shape Not Recognized
Symptom: shape: xyz doesn't work.
Solution - Check Valid Shapes: Valid shapes: rectangle, hexagon, cylinder, person, diamond, oval, cloud
Anything else defaults to rectangle.
Issue 6: Preview Not Updating
Symptom: Code changes don't reflect in preview.
Solution:
- Check for syntax errors (red underlines in editor)
- Try clicking outside editor to trigger refresh
- Reload page if stuck
FAQs About D2 Diagrams
Q: What is D2 diagram language?
D2 is a modern declarative diagram language created by Terrastruct for creating professional architecture diagrams, system designs, and infrastructure maps. Unlike drag-and-drop tools, D2 uses simple text syntax to define shapes, connections, and layouts, making it perfect for version control and collaboration. It's completely free to use on tools-online.app.
Q: Is D2 better than Mermaid for architecture diagrams?
D2 is generally better for complex architecture diagrams because it offers more shape options (hexagons, cylinders, persons), precise layout control, and advanced styling. Mermaid is better for simple flowcharts and documentation. Use D2 for system architecture, microservices, and cloud infrastructure. Use Mermaid for quick flowcharts in GitHub README files.
Detailed comparison: See our D2 vs Mermaid comparison
Q: Can I use D2 diagrams commercially?
Yes. D2 is open-source and free to use for commercial projects. All diagrams you create on tools-online.app belong to you with no restrictions. You can use them in documentation, presentations, client deliverables, or any business purpose.
Q: Does D2 support custom shapes and icons?
Yes. D2 supports multiple built-in shapes including rectangles, cylinders, hexagons, persons, diamonds, ovals, and clouds. You can also use custom icons by referencing image URLs. The D2 editor on tools-online.app includes templates for common architecture patterns like AWS, microservices, and database schemas.
Q: How do I export D2 diagrams?
On tools-online.app, you can export D2 diagrams in multiple formats:
- SVG (scalable, best for documentation)
- PNG (raster images for presentations)
- Copy to clipboard for instant sharing
All exports are free with no watermarks or limitations.
Q: Can AI generate D2 diagrams automatically?
Yes. The D2 editor on tools-online.app includes an AI-powered diagram assistant. Simply describe what you need (e.g., "create a microservices architecture with API gateway and three services") and the AI generates complete D2 code. You can then refine and export the diagram.
Learn more: AI-Powered D2 Generation
Q: How do I embed D2 diagrams in GitHub?
D2 doesn't have native GitHub rendering (unlike Mermaid). Instead:
- Generate diagram in D2 editor
- Export as SVG
- Upload SVG to your repo
- Reference in markdown:

For version control, store the .d2 source file alongside the exported SVG.
Q: What's the difference between D2 and GraphViz?
D2:
- Modern syntax, easier to learn
- Better for architecture diagrams
- Built-in shapes for modern tech stacks
- Excellent for microservices and cloud
- Older, more complex syntax
- Better for very large graphs (100+ nodes)
- Multiple layout algorithms (dot, neato, circo)
- Best for dependency analysis and network topology
Recommendation: Use D2 for most architecture work. Use GraphViz when you need to visualize complex dependencies or very large systems.
Q: Can I collaborate with my team on D2 diagrams?
Yes. D2's text-based format makes collaboration easy:
Option 1 - Git Workflow:
- Store
.d2files in Git repository - Team members edit via pull requests
- Review changes in diffs
- Merge when approved
Option 2 - Shared Exports:
- Create diagram on tools-online.app
- Export and share via Slack/email
- Team members can copy code to iterate
Option 3 - Documentation Integration:
- Embed SVG exports in Confluence/Notion
- Store D2 source alongside documentation
- Update when architecture changes
Q: How long does it take to learn D2?
Basic proficiency: 15-30 minutes You can create simple diagrams after reading the syntax basics section.
Intermediate skills: 2-3 hours After building 3-5 diagrams, you'll be comfortable with shapes, containers, and styling.
Advanced features: 1-2 days Mastering layout hints, classes, and complex architectures takes practice but isn't required for most use cases.
Compared to alternatives:
- Faster than learning Lucidchart (30-60 min)
- Slightly slower than Mermaid (5-10 min)
- Much faster than GraphViz (several hours)
Q: Does D2 work on mobile devices?
Yes. The D2 editor on tools-online.app is mobile-responsive. You can:
- View and edit D2 code on phones/tablets
- See live preview updates
- Export diagrams to PNG/SVG
- Typing on mobile is less convenient than desktop
- Complex diagrams easier to create on larger screens
Best practice: Create diagrams on desktop, view/present on any device.
Q: Are there D2 plugins for VS Code or other editors?
Yes. D2 has community-built extensions:
VS Code:
- Search "D2" in VS Code marketplace
- Provides syntax highlighting
- Live preview in side panel
Vim/Neovim:
- Various D2 syntax plugins available on GitHub
However, tools-online.app offers advantages:
- No installation required
- Always up-to-date
- AI generation included
- Instant export options
Q: Can I convert Mermaid diagrams to D2?
Not automatically, but manually converting is straightforward:
Mermaid:
graph TD
    A --> B
    B --> C
D2 Equivalent:
A -> B
B -> C
For complex diagrams, use the AI assistant: "Convert this Mermaid diagram to D2: [paste Mermaid code]"
Q: How do I handle very large architectures (50+ services)?
Best approach: Break into multiple diagrams.
Instead of one massive diagram, create:
- High-level overview (5-10 major subsystems)
- Per-subsystem details (10-15 services each)
- Data flow diagrams (specific user journeys)
- Infrastructure view (deployment architecture)
Link them together:
# Overview diagram
api_subsystem: API Layer {
  # See: api-subsystem-detail.d2
  tooltip: "Click for detailed view"
}
Store all .d2 files in organized structure:
docs/diagrams/
├── 00-overview.d2
├── 01-api-layer.d2
├── 02-data-layer.d2
└── 03-infrastructure.d2
Related Resources & Next Steps
Explore More Diagram Tools
Part of the complete diagram toolkit:
- Mermaid Editor - Best for flowcharts and GitHub documentation
- GraphViz Editor - Best for dependency graphs and large networks
- Gnuplot Editor - Best for scientific data visualization
Compare all tools: Online Diagram Tools: Complete Guide
Learn More
Tutorials & Guides:
Developer Resources:
External Documentation:
- Official D2 Language Tour - Complete syntax reference
- D2 GitHub Repository - Source code and examples
Complementary Tools on tools-online.app
Code Editors:
- TypeScript Editor - Build backend services
- Python Editor - Script automation
- Go Editor - Microservices development
- Java Editor - Enterprise applications
Data Tools:
- JSON Formatter - Format API responses
- YAML Editor - Kubernetes configs
Documentation:
- Markdown Editor - Write technical docs
- Online Notepad - Quick notes and planning
Need help? Check our complete diagram tools guide for more resources.